BrowseReporter offers 4 types of activity reports when monitoring your employees’ computer activities:
Here’s a list of all the BrowseReporter activity reports with sample report previews.
| # | Reports | Types | Columns | Preview |
| 1 | Sites Visited | Detailed | Websites, Titles, Start Date, Active Time, Total Time | All Domain Specific URL |
| 2 | Top Domains by Browsing Time | Summary | Domains, Active Time, Total Time | Click Here |
| 3 | Top Domains by Hits | Summary | Domains, Hits | Click Here |
| 4 | Total Browsing Time | Group Summary | Computers, Active Time, Total Time | Click Here |
| 5 | Keywords Searched by Hits | Detailed | Keywords, Search Engine, Hits | |
| 6 | Keywords Searched by Time | Detailed | Keywords, Search Engine, Search Date | Click Here |
| 7 | Employee Productivity | Dashboard | Productivity score, Productive/Unproductive Categories, Custom Domains | Click Here |
| 8 | Graph – Hourly Active Browsing Time | Summary | Active Time and Hours | Click Here |
| 9 | Graph – Weekly Active Browsing Time | Summary | Active Time and Days | Click Here |
| 10 | Graph – Top 10 PCs by Active Browsing Time | Group Summary | Computers and Active Time | |
| 11 | Graph – Top 10 Domains by Active Browsing Time | Group Summary | Domains and Active Time | Click Here |
| # | Reports | Types | Columns | Preview |
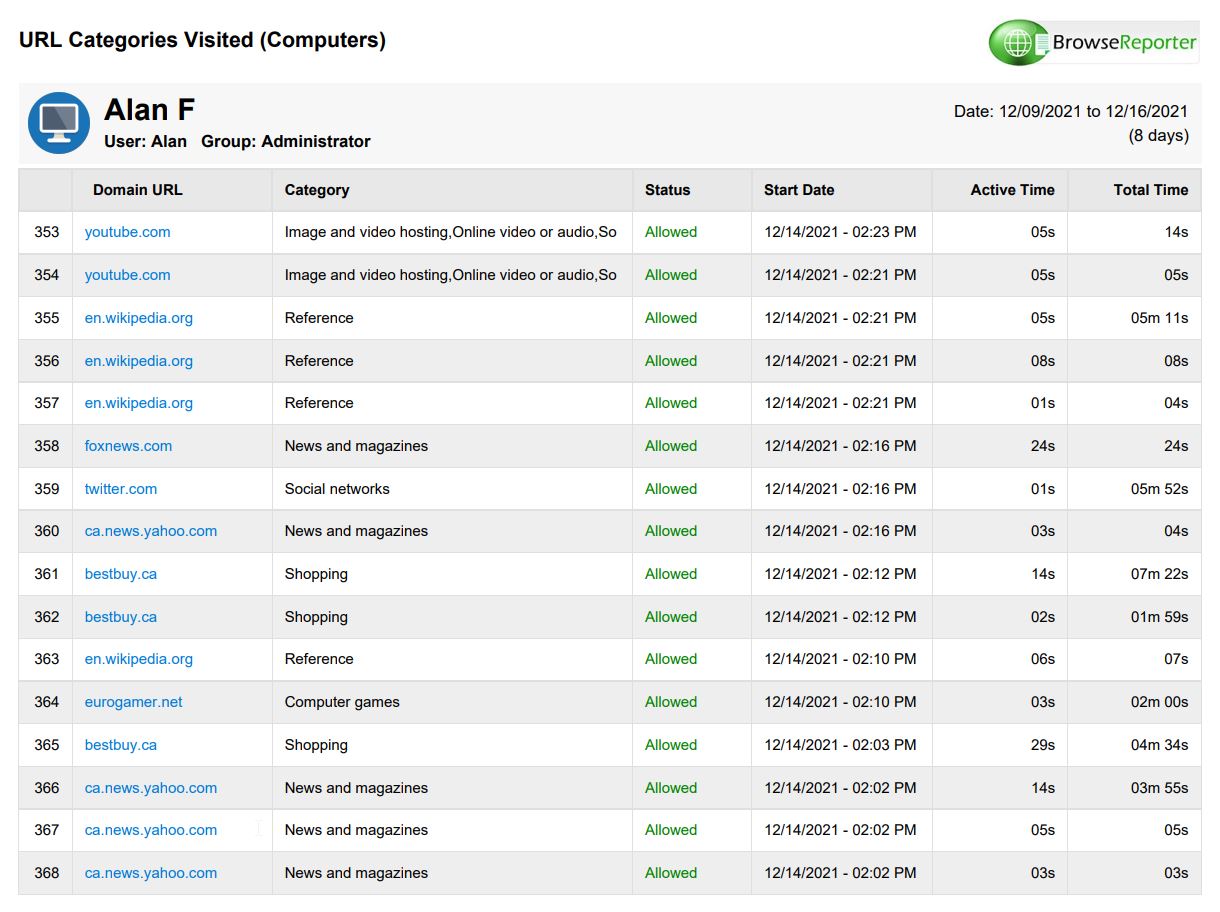
| 1 | URL Categories Visited | Detailed | Domain, Category, Block Status, Start Date, Active Time, Total Time | Click Here |
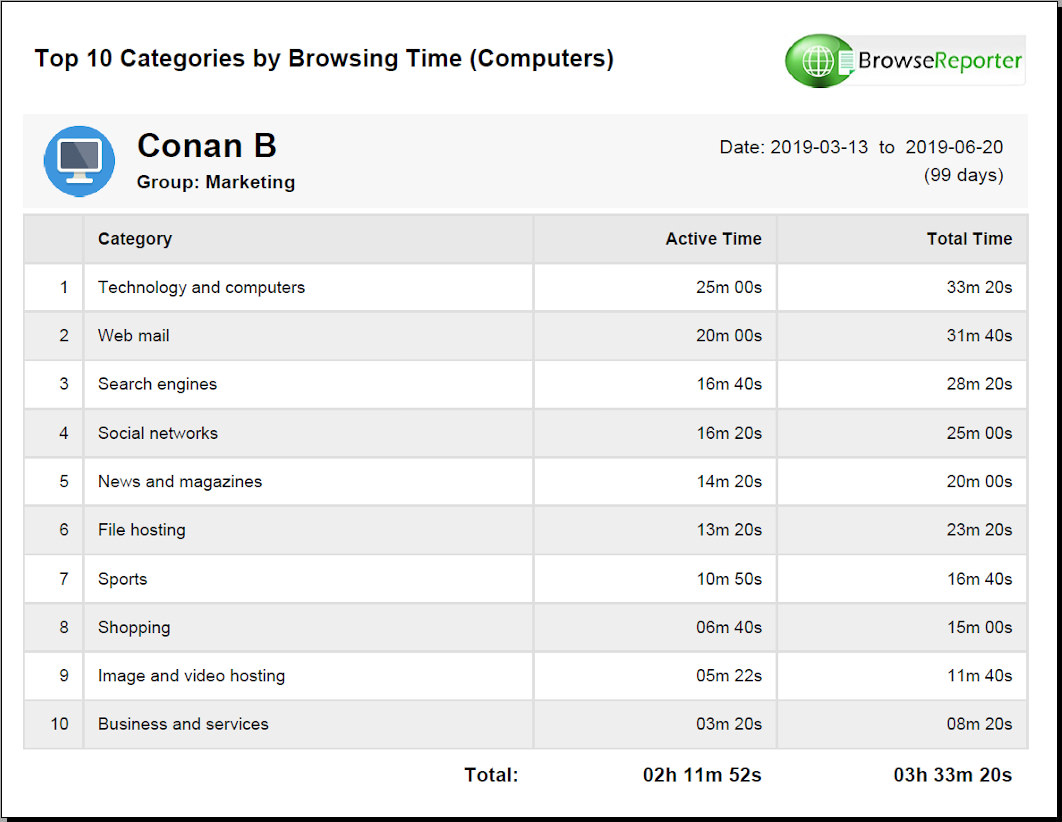
| 2 | Top Categories by Browsing Time | Summary | Category, Active Time, Total Time | Click Here |
| 3 | Category Drill Down | Drill down | Categories, Users, Domains | |
| 4 | Social Media Activities | Detailed | Websites, Start Date, Active Time, Total Time | Click Here |
| # | Reports | Types | Columns | Preview |
| 1 | Bandwidth Usage by URL | Detailed | Domain, Sent, Received | Click Here |
| 2 | Daily Bandwidth Usage | Summary | Date, Sent, Received | Click Here |
| 3 | Total Bandwidth Usage | Group Summary | Computers, Sent, Received |
| # | Reports | Types | Columns | Preview |
| 1 | Top Applications by Active Time | Summary | Applications, Active Time, Percentage | Click Here |
| 2 | Specific Applications Usage | Summary | Applications, Date, Active Time | |
| 3 | Application Usage by Hour | Detailed | Graph, Applications, Hourly Active Time | Click Here |
| 4 | Active & Idle time with Logon & Logoff Events NOTE: This report requires the enPowerManager solution. | Summary | Active Time and %, Idle Time and %, Login Times, Logoff Times | Click Here |