In
some cases, the administrator may want to change the logo on reports to
their company logo which would replace the CurrentWare BrowseReporter
Logo. This can be easily done through the Web Console.
Launch the CurrentWare Web Console.
Open Settings from the left-hand menu
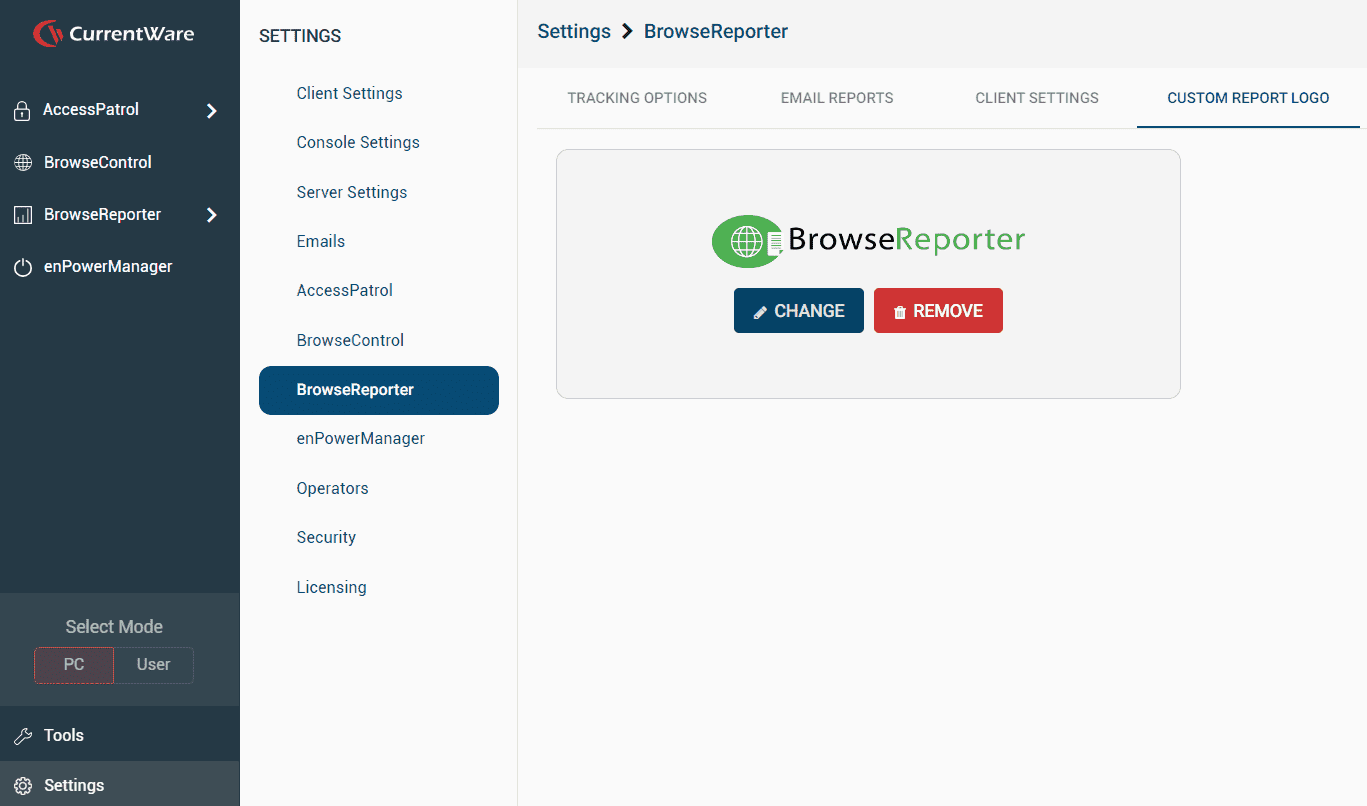
Select BrowseReporter and the “Custom Report Logo” tab
Select the CHANGE button
Drag and drop the image or select UPLOAD and find your logo file. NOTE: It is recommended that the logo be 300px by 200px and under 100KB.
Choose Save once you have found your appropriate logo file and run a report to see that the logo has changed.
Version 12.0.3 June 15, 2026 New Reports: Mouse Jiggler Detection and Login/Logoff with Location reports added Dashboard & Reporting Improvements: Total time column added to apps/websites dashboard; support for larger report ranges via the report ...
In addition to the user activity reports BrowseReporter includes 7 dashboards that give you insights on website activities, productivities, application usage and bandwidth consumptions of your entire organization. With BrowseReporter’s web ...
Effective productivity management is key to maximizing efficiency in today's work environment. This guide will provide links to support articles, samples, best practices, and setup guidance to maximize your CurrentWare deployment for optimizing your ...
You can easily reclassify website domains If you want to have it set as a different classification for your BrowseReporter reports and BrowseControl’s web category filtering database. To change the classification of a domain for your BrowseReporter ...
Data Activity Reports provide administrators with robust tools to monitor user data integrity, and server-client communication performance to ensure the server is reporting the most up-to-date data. Quickly identify users with missing data to address ...